
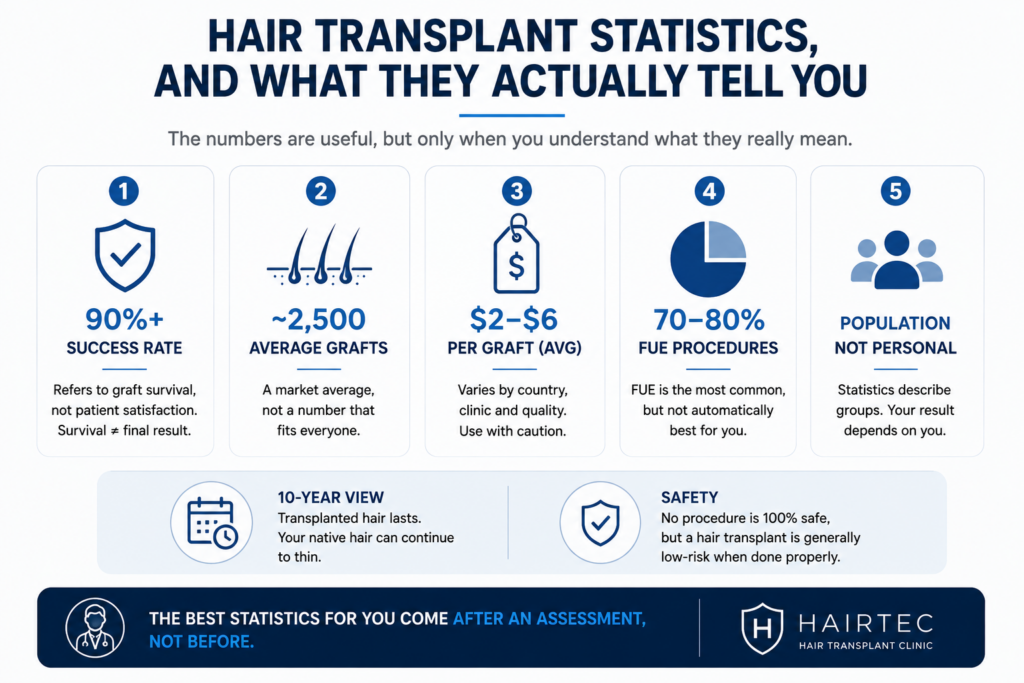
Search hair transplant statistics and the numbers come thick and fast. A success rate above 90 percent. Around three quarters of procedures done by FUE. An average of roughly two and a half thousand grafts. A global average cost of a few dollars per graft.
They sound authoritative, and some are genuinely useful. But a statistic is only as good as your understanding of what it measures, and this field is full of numbers that sound precise while quietly telling you very little about your own case. So rather than just list them, this piece reads them, what they mean, what they leave out, and which ones to take with a pinch of salt.
For the headline figures themselves, our hair transplant statistics page collects them in one place.
The success rate everyone quotes
The famous one is the success rate, usually put above 90 percent. It is real, and it is also narrower than it sounds.
That figure almost always refers to graft survival, the share of transplanted follicles that take and grow. It does not mean 90 percent of patients are happy with how they look. A transplant can hit a high survival rate and still disappoint if the hairline was badly designed or the density was planned poorly. Survival is necessary for a good result, but it is not the same thing, and a headline success percentage tells you nothing about the design skill behind it.
So when a clinic leads with a success rate, read it as a floor, not a promise. It says the follicles are likely to grow. It says nothing about whether they will be placed to look natural.
Averages that do not describe anyone
Then there are the average figures, the typical graft count and the average cost per graft.
An average graft count of a couple of thousand is a fine piece of trivia and a useless planning tool, because nobody has an average head. The number of grafts you would need depends on your pattern of loss, your stage and your goals, and it can sit well above or below any global average. The same goes for cost, which our hair transplant costs page treats as an individual figure rather than a headline rate.
An average cost per graft is especially slippery, because it collapses wildly different markets, clinics and quality levels into one tidy number. A low per-graft price often reflects high-volume work rather than a bargain, so the average tells you about the market, not about value.
Technique trends, and what they do and do not mean
You will see that most procedures worldwide are now FUE-based, often quoted at around three quarters or more.
That is a genuine trend, and it reflects a real shift toward less invasive extraction. What it does not mean is that FUE is automatically better for you, or that the technique is the thing that decides your result. Both of the modern approaches move the same follicular units and both look natural in skilled hands, so a statistic about which method is more popular says more about industry direction than about which is right for your case. Our Sapphire FUE page puts the technique in that context.
Popularity is not the same as suitability. A number telling you what most people get is not advice about what you should.
What the statistics quietly leave out
Here is the pattern running through all of it. Statistics describe populations, and you are an individual.
A success rate averages across thousands of cases with different surgeons, donor areas and aftercare. An average graft count blends full restorations with small touch-ups. A cost average spans countries with very different economies. Each number is true in aggregate and close to meaningless for predicting your specific outcome, which depends on variables no global figure can see, your donor supply, the stability of your loss, the skill of your team, and how well you follow the aftercare.
That is not a reason to distrust statistics. It is a reason to treat them as background, not as a forecast for you.
Two questions the raw numbers rarely answer well are worth naming, because people search for them constantly. One is what a transplant looks like ten years on. The honest statistical picture is that the transplanted follicles, taken from the resistant donor area, tend to keep growing long term, but the native hair around them can carry on thinning, so a ten-year outcome depends as much on managing the untouched hair as on graft survival. The other is safety, often framed as whether a transplant is 100 percent safe. No procedure is, and any statistic implying zero risk is a red flag, though performed properly it is generally considered low-risk. Both answers live in the caveats, not in a clean percentage.
How to use the numbers well
Read this way, the statistics become useful rather than misleading, so a few habits help.
Take a success rate as evidence the procedure generally works, not as a personal guarantee. Treat averages as rough context, and expect your own numbers to differ once you are assessed. Be suspicious of any figure quoted to a suspiciously exact decimal, since precision is often marketing rather than data. And remember that the most important numbers for you, your graft requirement, your realistic cost, your likelihood of a good result, only appear after an individual assessment, not before it.
The role of our doctors at Hairtec
Our team includes BIG-registered doctors, listed on the official Dutch medical register, working alongside experienced hair specialists.
Statistics are where a lot of hair transplant decisions start, and where a few go wrong, when a global average gets mistaken for a personal prediction. The value of an assessment is that it replaces the population figure with your figure.
The doctors lead the consultation and the medical assessment, and instead of quoting you an industry success rate they work out what is realistic for your donor area, your stage of loss and your goals. When the honest read differs from the reassuring average, you hear the honest read. Our free consultation page explains what that involves.
Frequently asked questions about hair transplant statistics
What percentage of hair transplants are successful?
Graft survival is commonly reported above 90 percent when the procedure is done well and aftercare is followed. That figure measures how many transplanted follicles grow, not how satisfied patients are with the overall look, so a good result also depends on planning and design.
What is the average number of grafts in a hair transplant?
Global averages tend to sit around a couple of thousand grafts, but the average describes the market, not you. The number you would need depends on your pattern of loss, stage and goals, so it can be well above or below any quoted average.
How much does a hair transplant cost on average?
Average cost-per-graft figures collapse very different markets and quality levels into one number, so they are poor guides to value. A realistic cost comes from an assessment of your specific case rather than a global average.
Are most hair transplants done with FUE?
Yes, the majority of procedures worldwide are now FUE-based, reflecting a shift toward less invasive extraction. Popularity does not make it automatically right for you, though, since both modern methods can give excellent results depending on the case.
Are hair transplant statistics reliable?
They are reliable in aggregate but limited for predicting your own outcome, because they average across many surgeons, patients and markets. Treat them as background context and rely on an individual assessment for figures that actually apply to you.
How we reviewed this article:
Hairtec.co.uk has strict sourcing guidelines and relies on peer-reviewed studies, academic research institutions, and medical journals and associations. We only use quality, credible sources to ensure content accuracy and integrity. You can learn more about how we ensure our content is accurate and current by reading our editorial policy.
Our experts continually monitor the health and wellness space, and we update our articles when new information becomes available


